Stream Health Assessment Map
RIVANNA WATERSHED STREAM CONDITIONS:
STREAMWATCH’S LONG-TERM MONITORING PROGRAM
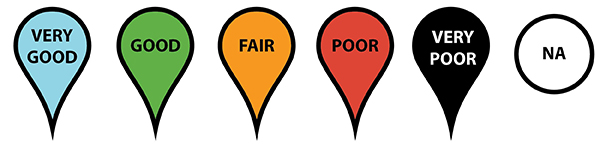
StreamWatch performs long-term monitoring at representative sites located throughout the Rivanna River watershed. In the map below, colored symbols show biological health at sites according to our most recent assessment. Click here for a map legend and description of the health tiers.
Data were collected from 2004 through fall 2014. Click the symbols for site name and locality.
To learn more about our assessment method, please click here to learn about biological monitoring, or read our reports.
To see the key and layers of each assessment period 2004-2006, 2005-2007, 2007-2009, 2009-2011, and 2011-2013, 2012-2014 click in the white box in the upper left hand of the map. Click on a site to see the stream health scores over the past 10 years.
You can read the most recent 2012 to 2014 Stream Health Report here.